
Most people who shop on Amazon regularly have no idea how their spending breaks down by category. Is it mostly household essentials? Electronics you told yourself you needed? Books? Pet supplies?
This guide walks you through how to get that breakdown, step by step.
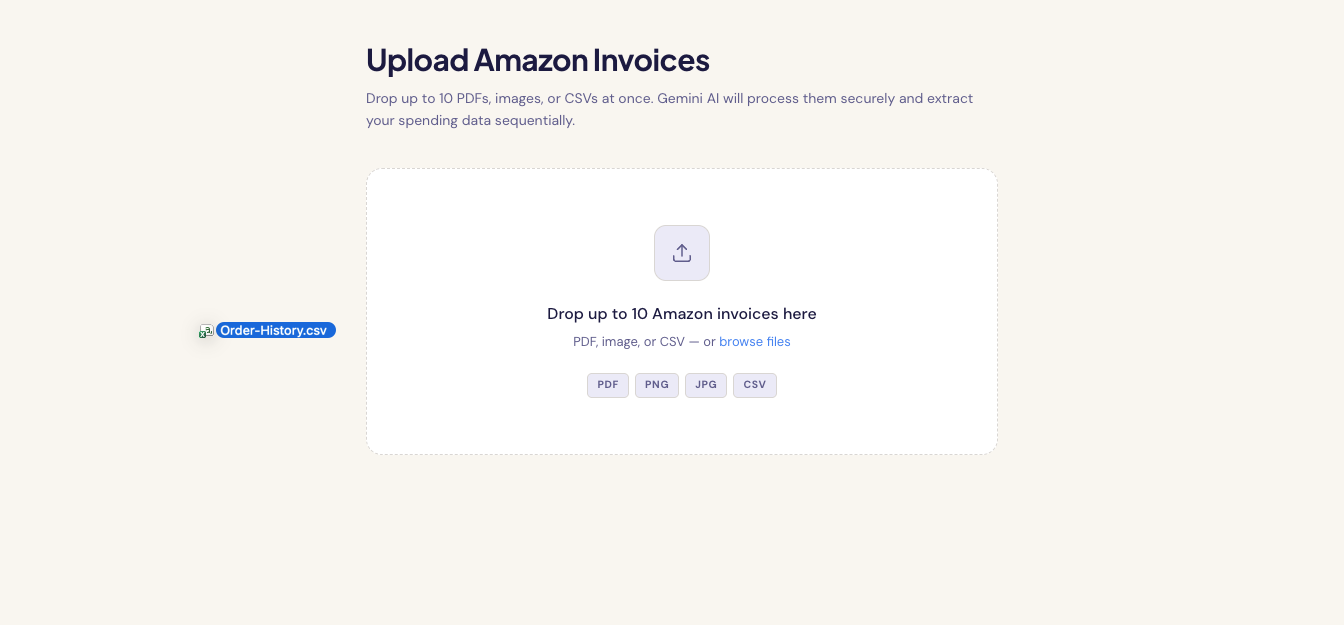
Step 1: Export your Amazon order history
Amazon lets you export your full order history as a CSV file. Here's how:
- Go to amazon.ca (or .com, .co.uk) and sign in
- Click Returns & Orders in the top right
- Scroll down and look for Order History Reports
- Select your date range (we recommend at least 12 months)
- Click Request Report
- Download the CSV when it's ready (usually takes a few minutes)
You now have a spreadsheet with every order, every item, and every price. The problem: it's raw data. It tells you what you bought, not what category it falls into.
Step 2: Get your spending categorized automatically
This is where most people get stuck. You could spend an hour manually tagging every row in a spreadsheet, or you can let AI do it for you.
Upload your CSV to AmazaSpend. The platform uses Gemini AI to automatically categorize every item in your order history. Within seconds, you'll see your spending broken down into categories like:
- Household essentials
- Electronics & tech
- Clothing & accessories
- Books & media
- Pet supplies
- Health & personal care
- Food & grocery
- Toys & games
- Office & home improvement
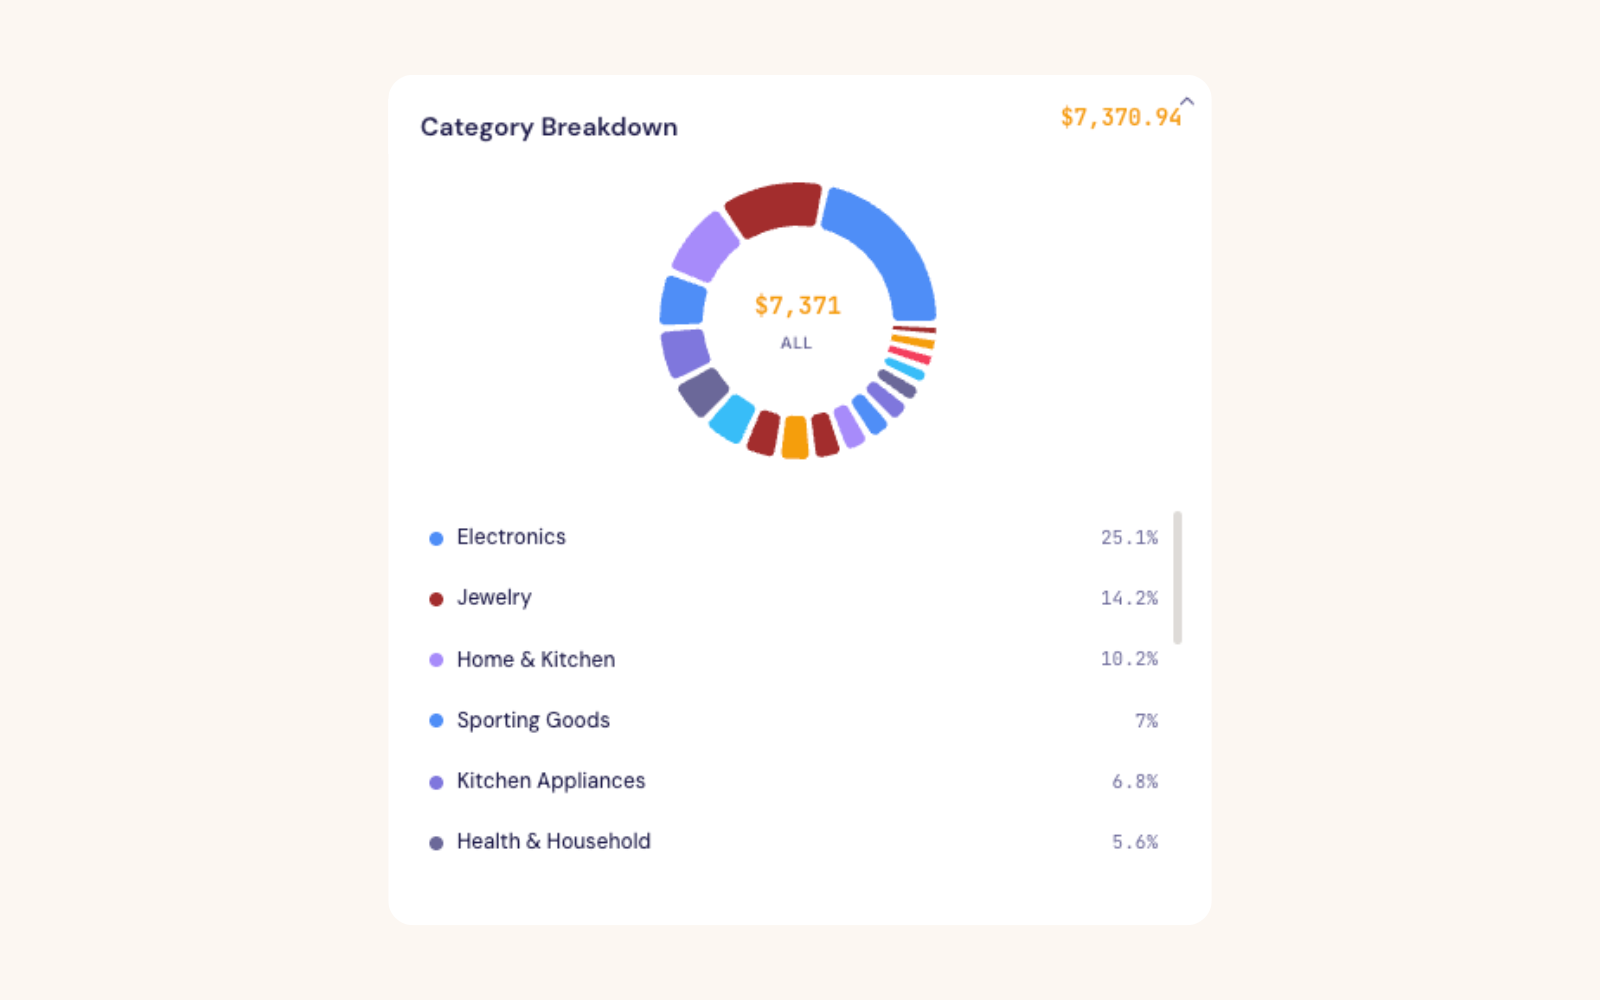
Step 3: Read your category breakdown
Once categorized, AmazaSpend shows you two views that are immediately useful:
The category donut chart, your spending, proportionally, by category. At a glance, you can see which category dominates. Most people are surprised by at least one result.
The monthly bar chart, your total spend per month, and how it trended over the year. You can see seasonal spikes (hello, November) and quiet months.
Step 4: Go one level deeper, impulse vs. essential
Category alone doesn't tell the whole story. Two people can spend $300 on "household" items in a month, one is buying toilet paper and dish soap, the other is buying a third set of matching bathroom accessories because they looked nice.
AmazaSpend classifies every item as either Essential or Impulse, automatically, using AI. Essentials are things you would have bought regardless. Impulse items are reactive, convenience-driven, or emotionally motivated purchases.
You can override any classification. If the AI got one wrong, tap it and change it. Your classification history is saved.
This is the layer that actually tells you something useful: not just what you spent, but why.
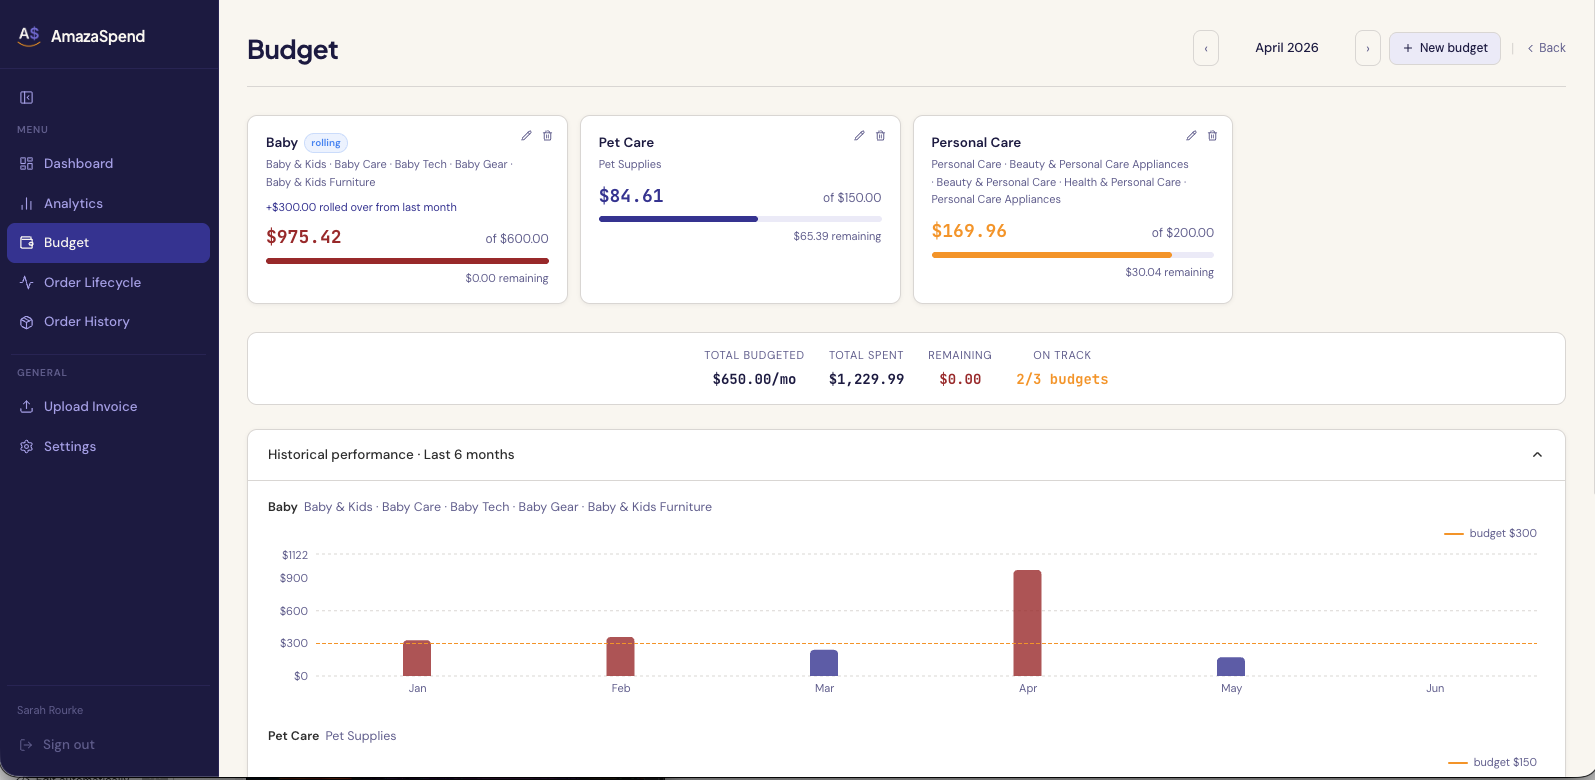
Step 5: Set a category budget and track your pace
Once you can see your category breakdown, you can set a budget for it.
In AmazaSpend's budget section, you create monthly limits by category group. During the month, the app shows you your current pace, how much you've spent so far, projected to end of month, and whether you're on track.
Green means you're fine. Amber means you're close. Red means you'll overshoot if you don't course-correct.
What most people find when they first categorize their spending
We've seen a few common patterns:
- The "household" category is usually bigger than expected, because Amazon has quietly become the default place to buy everything from cleaning supplies to batteries to storage solutions
- Electronics is usually more impulsive than people think, gadgets, cables, adapters, "this one thing that will finally organize my desk"
- Returns cluster in clothing and home décor, items that didn't look the same in person as they did in the product photo
None of these are moral judgments. They're just patterns, and patterns you can see are patterns you can do something about.
The alternative: doing it manually
For completeness, here's how you'd do this in a spreadsheet:
- Open your CSV in Excel or Google Sheets
- Add a "Category" column
- Manually tag every row (expect 1–2 hours for a year of orders)
- Build a pivot table grouped by category
- Create a chart from the pivot table
- Repeat next month
That works. AmazaSpend just does it for you, automatically, with AI classification that handles edge cases you'd have to manually decide.
Start with a 12-month view
If you've never done this before, pull 12 months. Don't just look at last month, last month might be atypical. A 12-month view gives you seasonal patterns, your real average monthly spend, and a baseline you can track against going forward.
Try AmazaSpend free, upload your CSV in under 2 minutes →